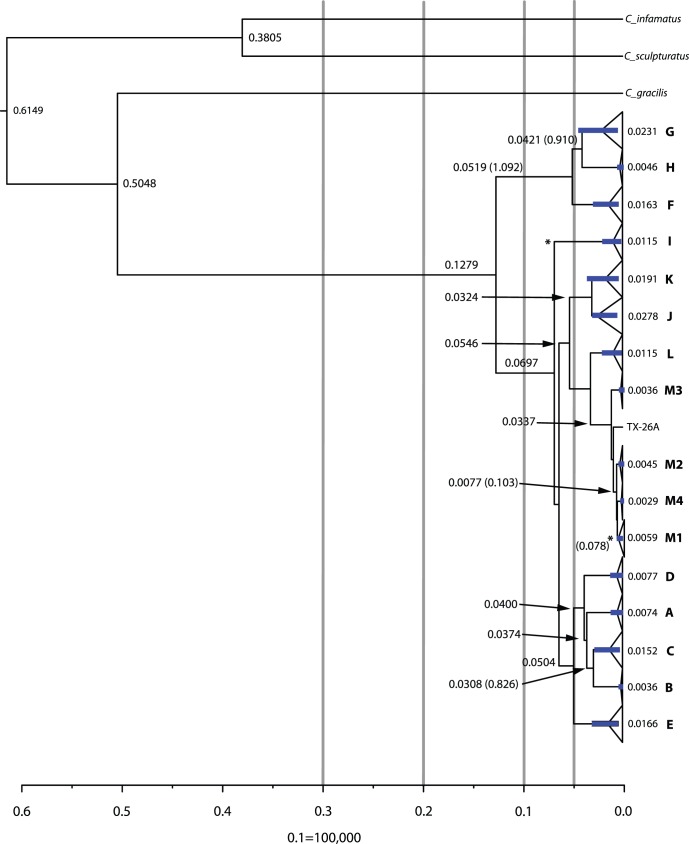
Figure 6. A tree created in BEAST to show regional clade divergence.
Letters represent regional network clades as in Figure 4 with northeastern populations further divided into M1 (populations proposed to have been affected through the Hypsithermal expansion), M2 (Louisiana population), M3 (east central Texas population) and M4 (southeast Texas population). Node values represent divergence times in million years with MDIV divergence times in parentheses (see Table S2 for further MDIV divergence statistics and Table S3 for divergence dates calculated in BEAST with different constraints). Error bars (95% confidence intervals) are shown in blue and the calibration points are shown with an asterisk (*).

