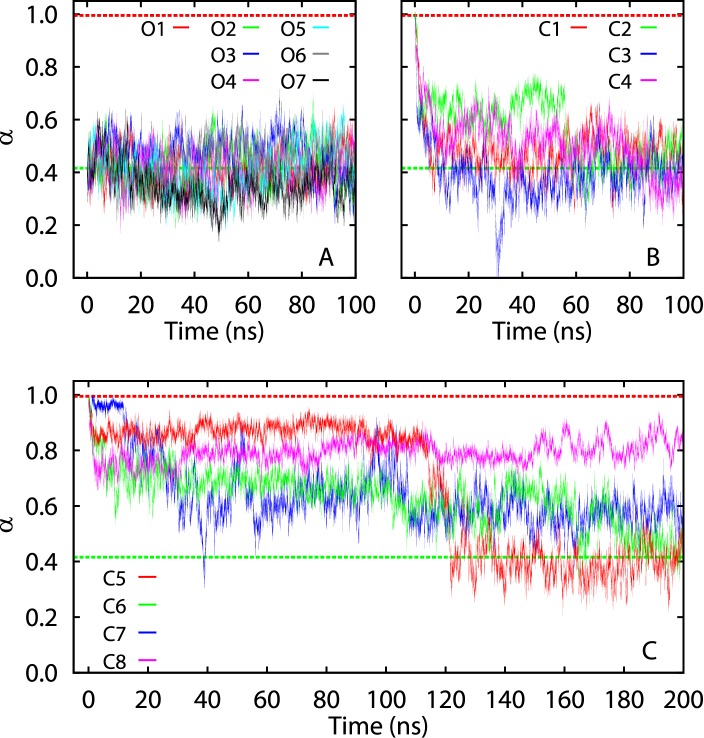
Figure 2. Time evolution of the unrestrained simulations along a conformational pathway.
The pathway is represented by a parameterized curve  (see Methods). Each protein conformation
  in the simulation trajectories was projected onto this curve through the operator
  (see Methods), which returns the curve parameter
  corresponding to the point
  on the curve with the shortest distance to
  . This operator was implemented through a nonlinear minimization algorithm. The projected curve parameter is plotted as a function of time for each simulation trajectory. The green and red dashed lines indicate the projected curve parameters for the open (α = 0.42) and closed (α = 0.99) crystal structures, respectively.

