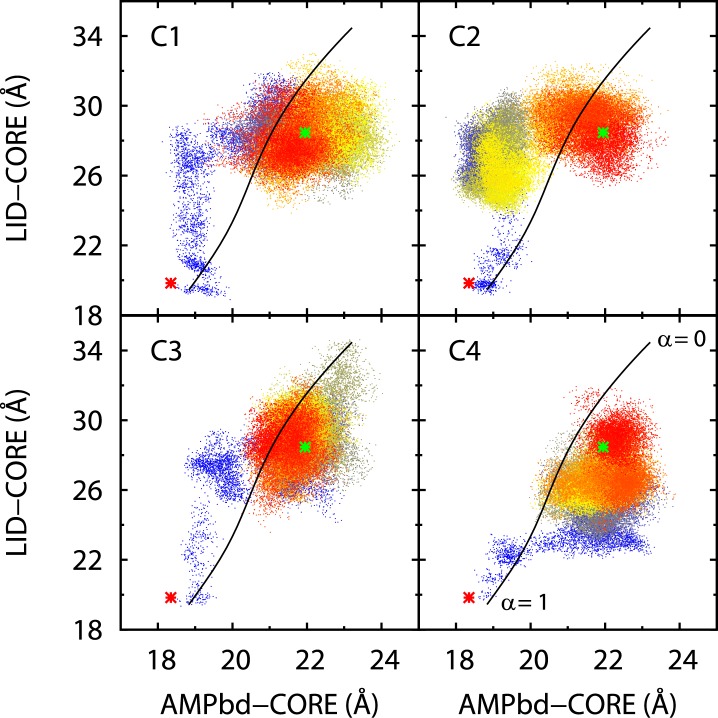
Figure 3. Evolution of the distances between the domain centers.
The center of each (CORE, AMPbd, or LID) domain is defined by the average position of its C atoms. Distances between these centers are calculated for four 100-ns unrestrained simulations (C1–C4). Each frame in the simulation trajectories corresponds to one point in the figure, with the color denoting the progression of the simulation, from blue at the onset (via yellow) to red at the end of the simulation. The black curve represents a pathway averaged from all unrestrained simulations (see Methods) and used as the principal curve in the umbrella-sampling simulations. The green and red stars indicate the positions of the open and closed crystal structures, respectively.

