
Figure 5. A comparison of the average conformations from the umbrella-sampling simulations to the crystal structures.
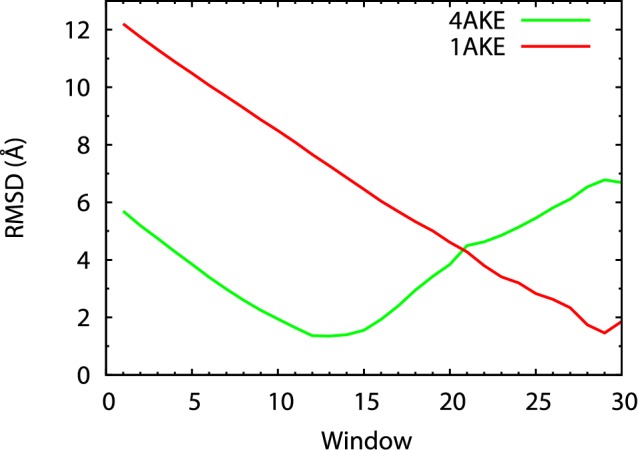
Average Cα coordinates for each of the 30 umbrella windows were calculated from the trajectories. The RMSDs between these average Cα coordinates and the two crystal structures are plotted in the figure.