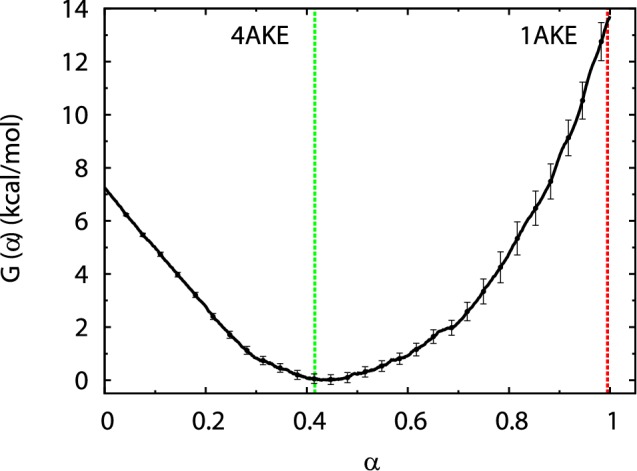
Figure 6. Free energy profile of AdK conformations.

The free energy  was defined along a conformational pathway (see Methods), and calculated from the umbrella-sampling simulations. The plotted error bars are for the free energy difference with respect to the first umbrella window at α = 0, estimated from the statistical uncertainties in the mean coordinate [40]. The green and red dashed lines indicate the projected locations of the open and closed crystal structures, respectively.
