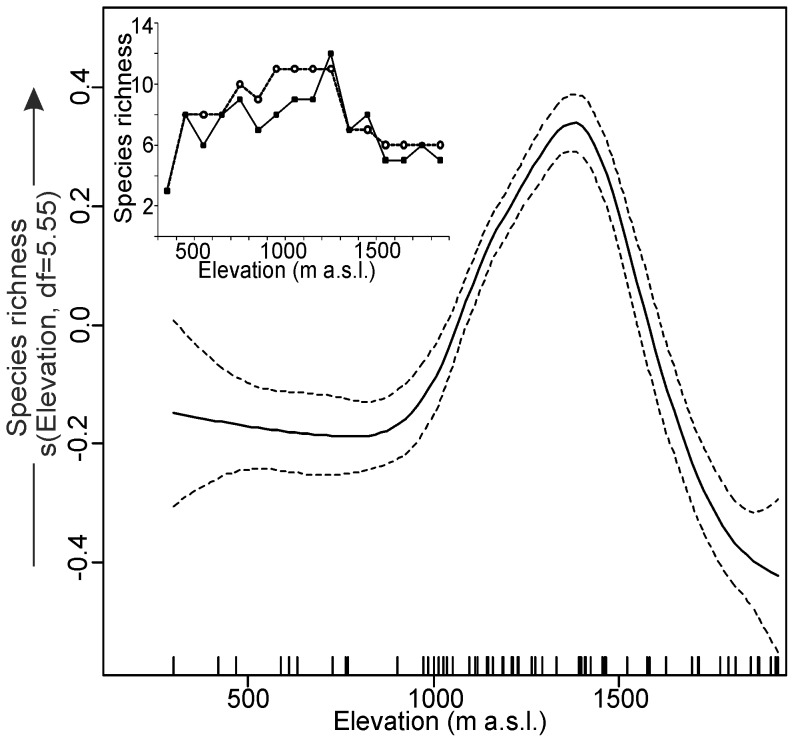
Figure 4. Spline fit (solid line) with 95% confidence interval (dashed lines) of the variability in the species richness of bat assemblages wintering in 70 caves in the Polish Carpathians as a function of elevation (GAM: species richness∼intercept+s(elevation)).
In the inner subplot empirical (solid line and black squares, number of recorded species on each 100-m vertical bands) and interpolated (dashed line and open circles, species was recorded at range between the highest and the lowest records) species richness are presented.

