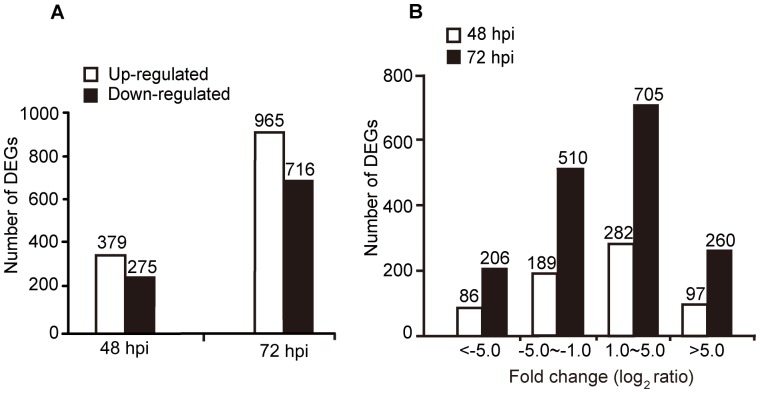
Figure 2. Analysis of differently expressed genes (DGEs).
(A) An overview of DEGs between the whitefly libraries of 48 hpi and control, and of 72 hpi and control. The numbers of up- and down-regulated genes are marked above each bar. The white and black bars indicate the up- and down- regulated genes, respectively. (B) The distribution of fold changes (log2 ratio) of DEGs.

