
Figure 4. Ratio of IL-10/IL-12 upon incubation of PBMCs with different chain length β2→1-fructans.
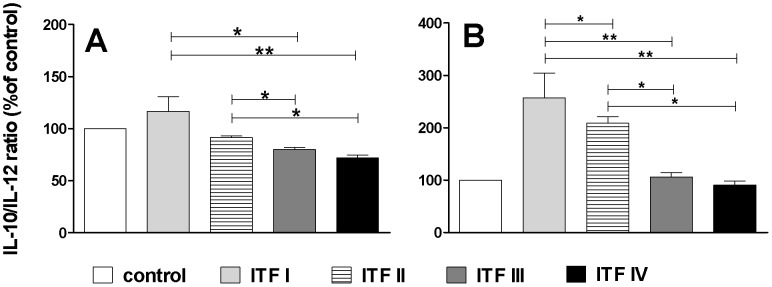
PBMCs (n = 6) were stimulated with 1 µg/ml (panel A) and 100 µg/ml (panel B) β2→1-fructans for 24h. Statistical significance levels were determined with a non-parametric Mann-Whitney U-test for unpaired observations (two-tailed). Mean and SD of the IL-10/IL-12 ratios is plotted for the different β2→1-fructans as percentage of controls, which were set to 100% (n = 6) and horizontal bars indicate the significant differences between β2→1-fructan treatments.