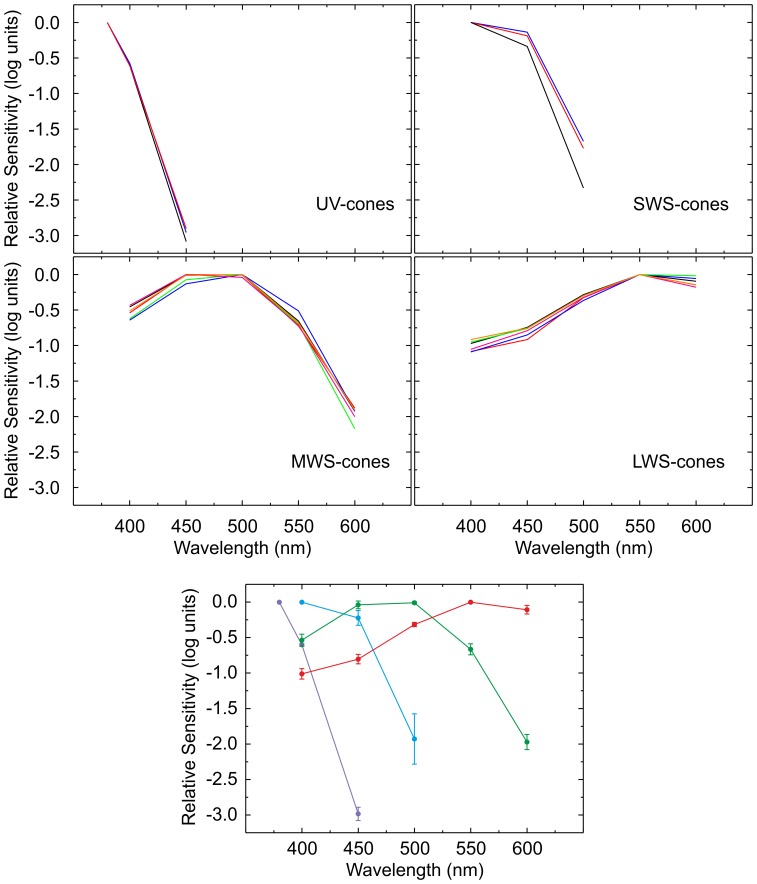
Figure 2. Action spectra of individual cells and averages per cone-type.
In the top four panels the relative sensitivity is plotted against the stimulus wavelength of individual cones grouped according to cone-type as indicated in the graph. The bottom panel displays the average spectral sensitivity for the different cone-types.

