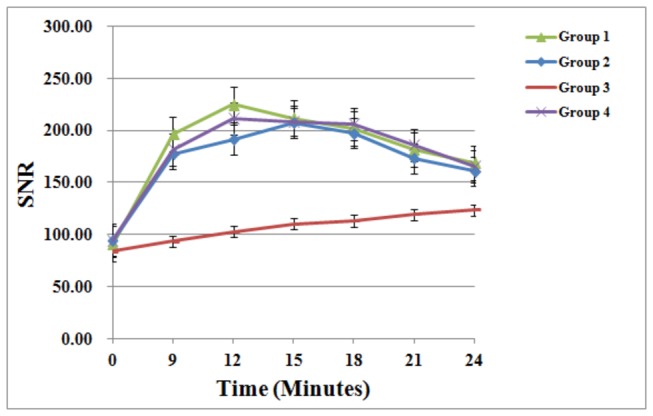
Figure 4. Axillary lymph nodes contrast-uptake kinetics of the four patient groups.

Graph of enhancement profile over time as determined with signal-to-noise ratio (SNR) measurements in the axillary lymph node shows a different contrast -uptake kinetics of the four patient groups. ANOVA test results show that the SNR (at the maximum enhancement height) of the lymph nodes in group 1, 2 and 4 was significantly higher than that in group 3 (SNR: F ratio=17.613, p<0.001), though there was no significant difference between groups 1, 2 and 4. Error bars represent standard errors of the mean.
