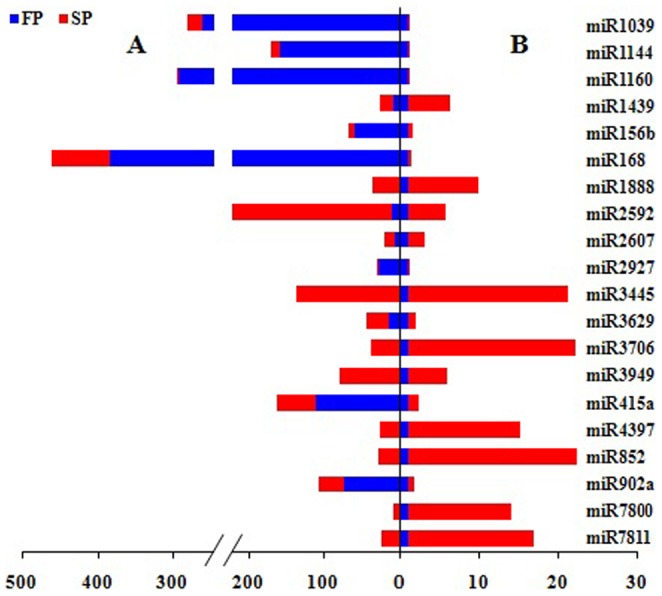
Figure 3. Comparison of partial differently expressed miRNAs in FP and SP R.

glutinosa using high-throughput sequencing and qRT-PCR. A, the relative expression levels (normalized values) measured by high-throughput sequencing; B, the relative expression levels (2−△△CT) tested by qRT-PCR. Red, expressing levels in SP. Blue, expressing levels in FP.
