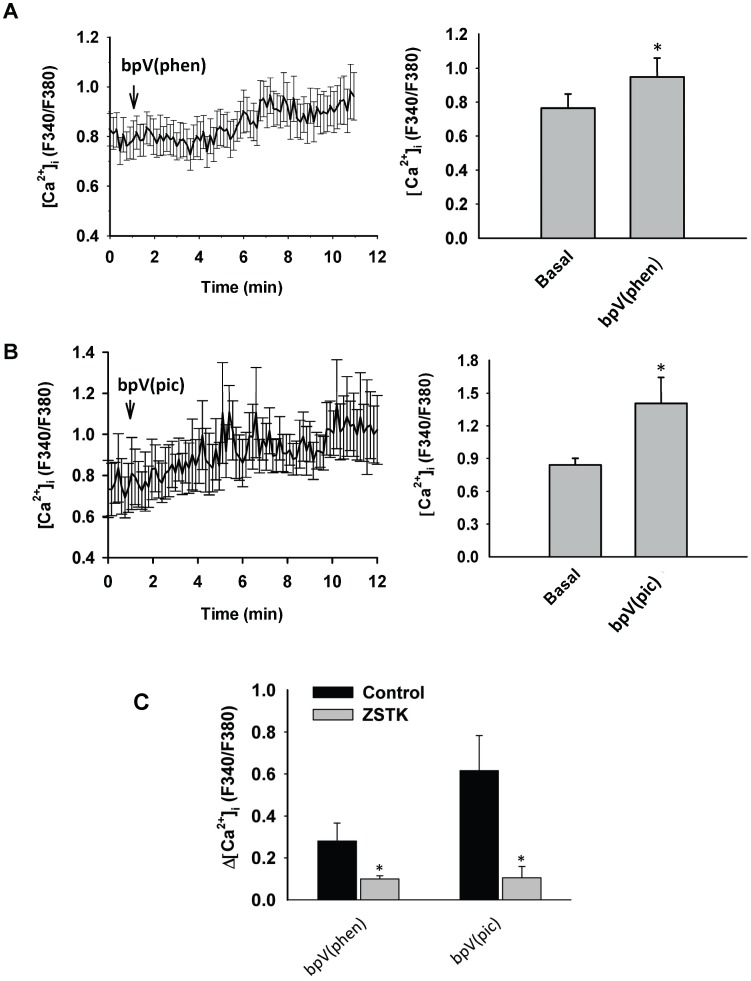
Figure 9. Effects of the specific PTEN inhibitor bpV(phen) (10 µM) or bpV(pic) (10 µM) on [Ca2+]i response of Fura-2AM loaded freshly isolated cerebral arterial muscle cells (CAMCs).
Treatment of the Fura-2AM loaded CAMCs with 10 µM bpV(phen) (A) or with 10 µM bpV(pic) (B) caused a significant increase in [Ca2+]i that developed over time. Bar graphs shown on the right of panel A or panel B depict summary of the ratio of the fluorescent calcium signals indicating a significant increase in the ratio of [Ca2+]i in response to treatment with the PTEN inhibitor bpV(phen) (10 µM) or 10 µM bpV(pic) as compared to the respective controls. n = 5–6 independent experiments for each group. *denotes significant increases in [Ca2+]i at p<0.05. (C) bar graphs depicting the ability of the PI3K inhibitor ZSTK474 (1 µM) to significantly attenuate or prevent the PTEN inhibitor bpV (phen) (10 µM) or bpV (pic) (10 µM) induced increase in [Ca2+]i expressed as change in the ratio of [Ca2+]i in CAMCs loaded with Fluor-2AM. *denote significant difference from control at p<0.001; n = 4 to 5 independent experiments.

