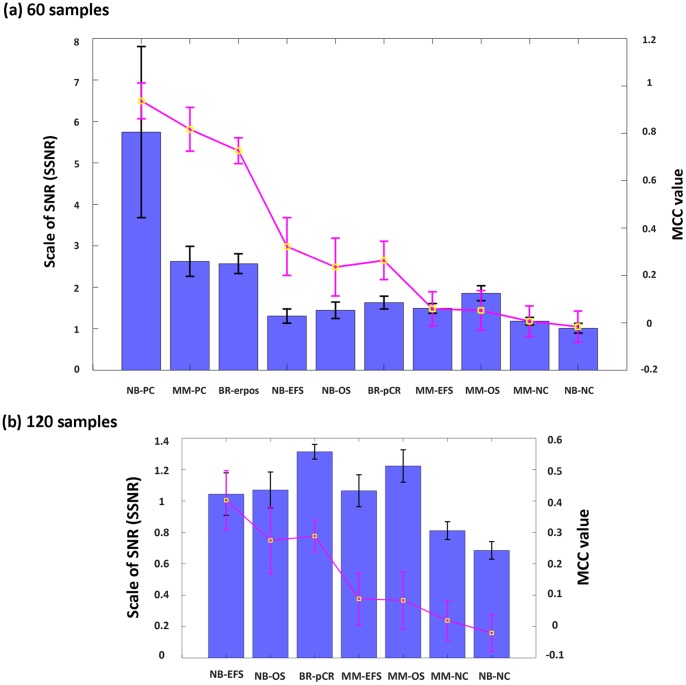
Figure 4. Relationship between SSNR and endpoint predictability based on 60 and 120 training samples.
The relationship between SSNR values and endpoint predictability (prediction MCC) based on (a) 60 and (b) 120 training samples using NCentroid, respectively. Here blue columns and black bars represent the means and SDs of SSNR values in 100 repetitions, while yellow rectangles and red bars are means and SDs of MCC values.

