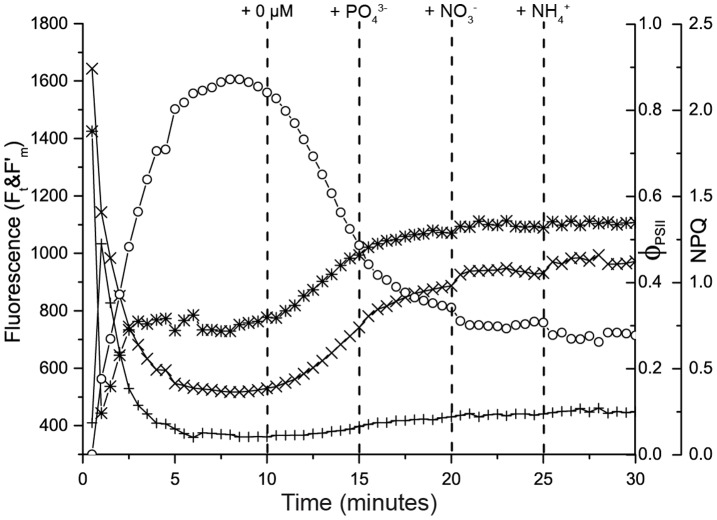
Figure 7. Typical NIFT response of Thalassia testudinum.
Example of the NIFT response of a T. testudinum leaf collected at Boka Ascension. The graph shows the time courses of steady-state fluorescence, Ft (+); maximum fluorescence, F′m (×); the quantum yield of photosystem II, ΦPSII (∗); and non-photochemical quenching, NPQ (○). Vertical dashed lines indicate the timing of the control addition (0 µM) and the sequential addition of different nutrients (all at 100 µM).

