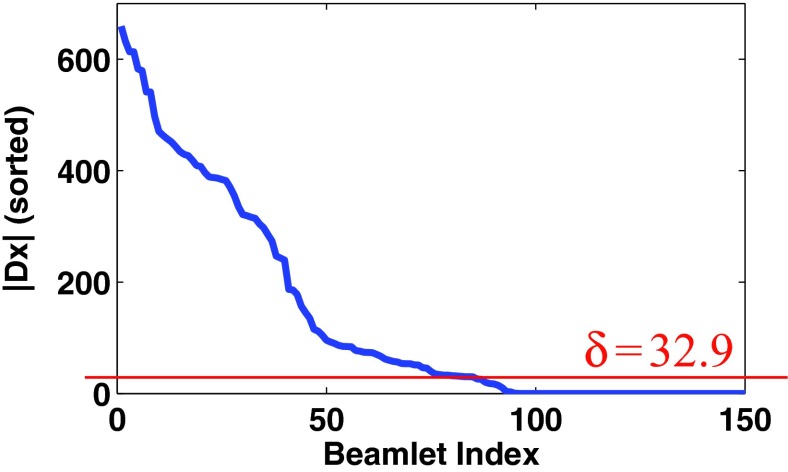
Figure 1.
This shows how to determine the field-specific constant δf in this work. The figure represents the sorted fluence-map variations (|(Dx)u, v, f|) acquired at 4th field of Prostate1 data after fluence-map optimization with TV min. at the first iterate. The horizontal line corresponds to the 5% smallest value of the sorted fluence-map variation, which will be used to determine the weight for each element as a constant δf in the field.

