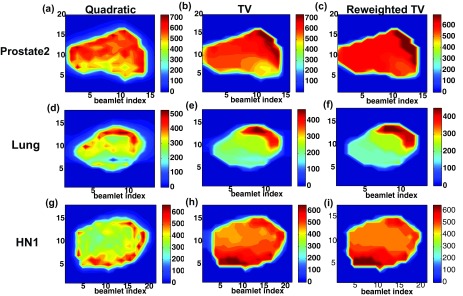
Figure 2.

Fluence-maps acquired by quadratic min., TV min. and reweighted TV min. (proposed) for (a)–(c) Prostate2, (d)–(f) Lung, and (g)–(i) HN1 clinical data sets. The perpendicular bar in right-hand side for each figure represents the beamlet intensities. The proposed method successfully generates simplified fluence-maps than the other two techniques.
