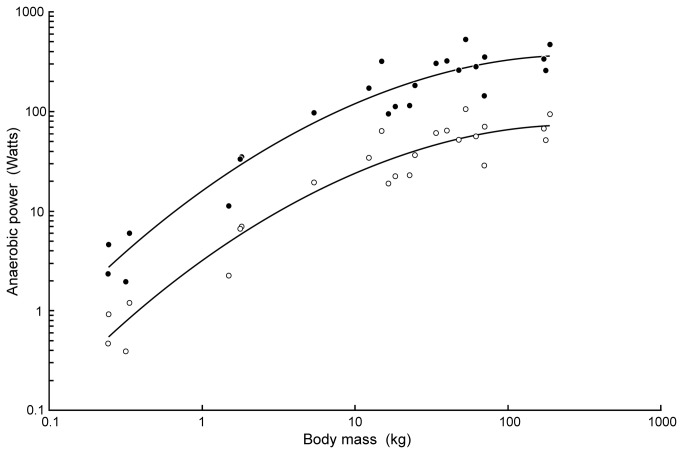
Figure 2. Rate of anaerobic power generation in Crocodylusporosus in relation to body mass.
Lower data set (open circles) is the measured mean rate over the entire course of exercise to fatigue [25]. Upper data set (filled circles) is the calculated burst rate during the first 10% of the exercise period, assuming that the rate decreases exponentially to zero at exhaustion. This multiplies the mean rate by a factor of 5. The curves are 3-parameter regressions set to the data (see text).

