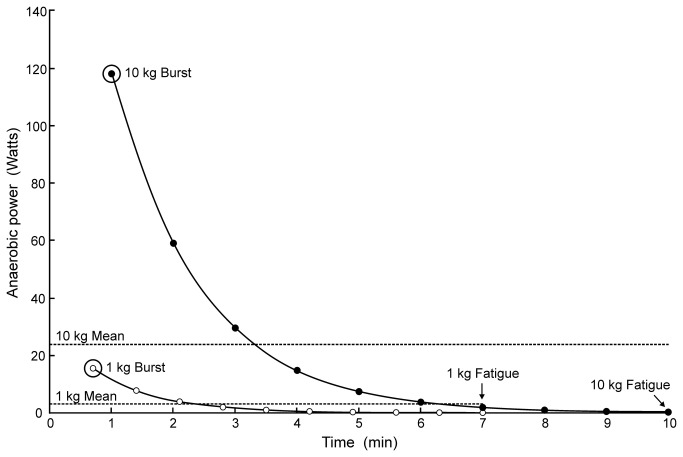
Figure 3. Rate of energy production (power) from anaerobic glycolysis during exhaustive exercise in Crocodylusporosus .
To fit on the figure, only 1 kg and 10 kg body masses are plotted (data not shown for larger animals). The total energy produced anaerobically during the entire exercise period is related to the area under each curve. Horizontal lines indicate mean anaerobic power to the point of fatigue. Curves are assumed exponential decreases in power during the exercise period. The highest points on the left represent burst power during the first 10% of exercise and are used to estimate the maximum initial anaerobic contribution to exercise. Data are derived from [25].

