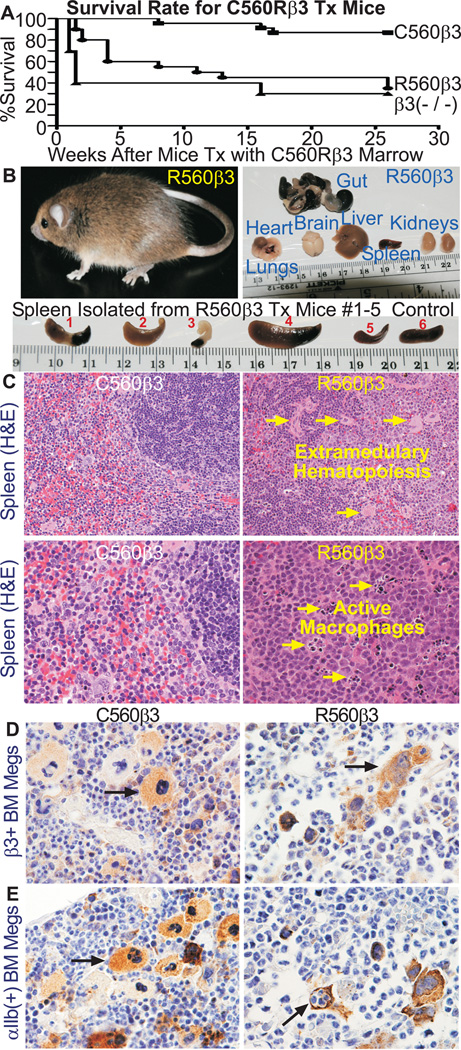
Figure 2. R560β3 Mice had a Significantly High Mortality Rate.
(A) Graph of Survival Rates for C560β3 and R560β3 tx Mice. Results demonstrate that 87% of C560β3 mice survived for at least 26 weeks post tx (n=23), while in contrast, 50% R560β3 animals died by 11 weeks after tx and only 35% of R560β3 mice survived until the experimental endpoint (n=20). Results with β3(−/−) mice tx with untransduced β3(−/−) bone marrow as a negative control (n=10) revealed that nearly 60% of β3(−/−) tx mice died by 1.5 weeks after lethal irradiation and bone marrow tx. Although, the endpoint survival of R560β3 mice was nearly identical to the 30% survival rate of β3(−/−) mice tx with untransduced marrow.
(B) Tissue Analysis Revealed R560β3 Mice in Pathological Crisis. Top Left, shown is one of thirteen R560β3 mice that displayed pathological crisis, which usually resulted in death 48 hours after sudden onset of a hunched appearance and pale-white extremities. Top right, intact organs were isolated from R560β3 mice in pathological crisis. Analysis showed heart, lungs, brain, liver, and kidneys appeared normal in all mice, although gut appeared black and necrotic in one mouse which is consistent with results from hemocrlt counts indicating severe gastrointestinal bleeding. Tissues were fixed, sectioned, stained and analyzed as described in methods from nine R560β3 mice in crisis, nine R560β3 mice that appeared well, and three each of C560β3 and β3(−/−,+/−,+/+) controls. Bottom, R560β3 mice spleens (#1–5) appeared mostly abnormal in size and shape (large and/or necrotic) compared to a healthy spleen from a normal control (#6). Shown is spleen from five of nine R560β3 affected mice that underwent autopsy and tissue analysis.
(C) R560β3 Mice had Abnormal Spleens. Top Left, H&E staining of spleen tissue indicated the C560β3 mice displayed normal spleen morphology at 200× magnification. In contrast (Top Right) extramedullary hematopoiesis (arrows) was detected in spleen sections from several R560β3 mice in crisis. Bottom Left, H&E staining indicated C560β3 mice displayed normal spleen morphology at 400× magnification. Bottom Right, in contrast numerous activated macrophages (arrows) were detected in the process of repair of pathological conditions within R560β3 murine spleens.
(D) R560β3 Megakaryocytes were Shaped Abnormally within the Bone Marrow. Immunohistochemical brown staining with Ab recognizing integirn β3 showed megakaryocytes expressing C560Rβ3 in vivo (Magnification, 400×). Left panel shows that C560β3 megakaryocytes appeared normal in shape and size (arrow), while in contrast, the right panel revealed that R560β3 megakaryocytes appeared abnormal in shape and clustered within the bone marrow (arrow). Results represent observations of bone sections from β3(−/−,+/−,+/+) controls and three mice expressing either C560β3 or R560β3.
(E) R560β3 Megakaryocytes Were in a Pathological State. As described in Part D, an Ab to integrin αIIb showed C560β3 megakaryocytes appeared healthy (top left arrow), while in contrast R560β3 Megakaryocytes appeared abnormal in shape (top right arrow). Interestingly, occasional R560β3 megakaryocytes had engulfed neutrophils by emperiopoiesis (bottom right arrow) indicating that the megakaryocytes were activated atypically. Result represents observations of bone sections from β3(−/−,+/−,+/+) controls and three C560β3 or R560β3 mice. (Magnification, 400×)

