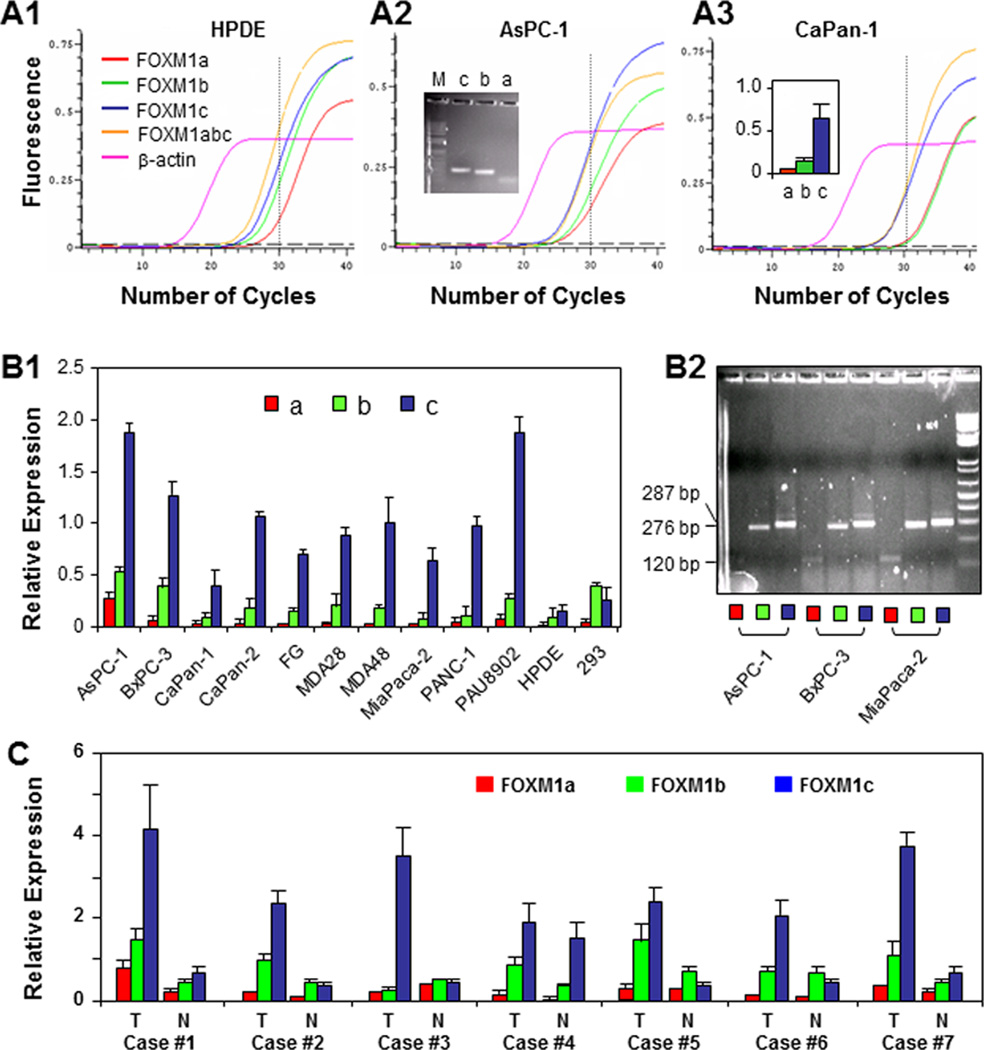
Figure 2.
Expression of FOXM1a, FOXM1b, and FOXM1c in pancreatic tumors and cancer cell lines. A, qPCR reaction curves created using PCR primers specific for FOXM1a, FOXM1b, and FOXM1c with β-actin used as a control. PCR products generated over 30 cycles were resolved electrophoretically on a 2% agarose gel and visualized using ethidium bromide staining (image 2, insert), and relative levels of FOXM1a, FOXM1b, and FOXM1c expression were measured (image 3, insert). B, relative expression of FOXM1a, FOXM1b, and FOXM1c as determined using qPCR with isoform-specific primers (image 1). The qPCR products over 30 cycles were resolved electrophoretically on a 2% agarose gel and visualized using ethidium bromide staining (image 2). C, relative expression of FOXM1a, FOXM1b, and FOXM1c in seven paired normal pancreatic tissue specimens (N) and pancreatic tumor specimens (T) as determined using qPCR analysis with isoform-specific primers.

