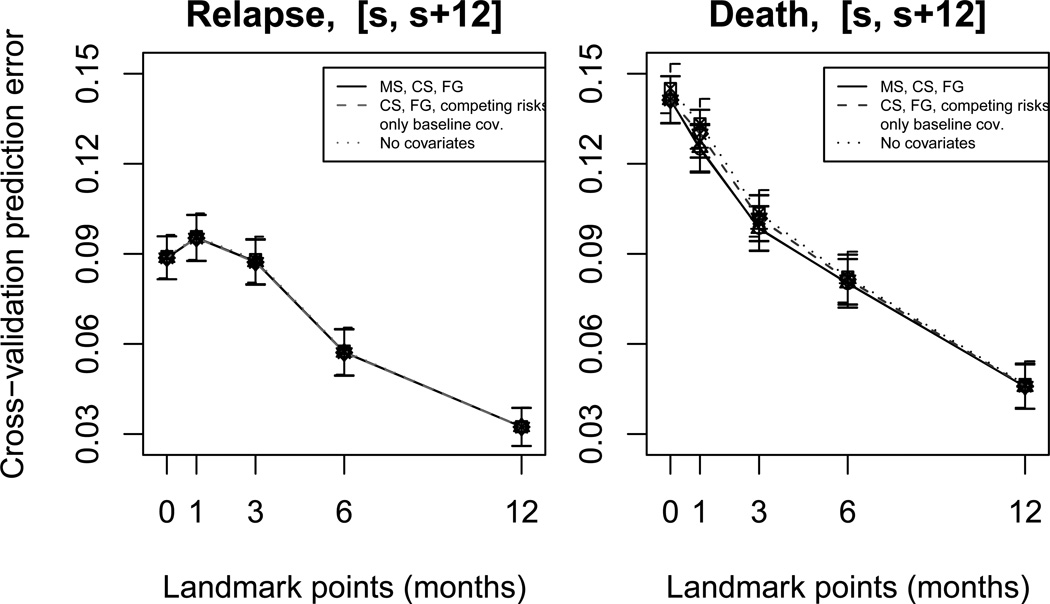
Figure 5.
Cross-validated one-year prediction errors (and their standard deviation), evaluated by the pseudovalue estimator, at landmarks s ∈ ℒ = {0, 1, 3, 6, 12}. Prediction errors were computed under the multi-state, cause-specific and Fine-Gray landmark approaches (solid lines), under the cause-specific and Fine-Gray landmark approaches and under the standard competing risks model in case GvHD is ignored (only baseline covariates) (dashed lines), under a competing risks model with no covariates (dotted line).

