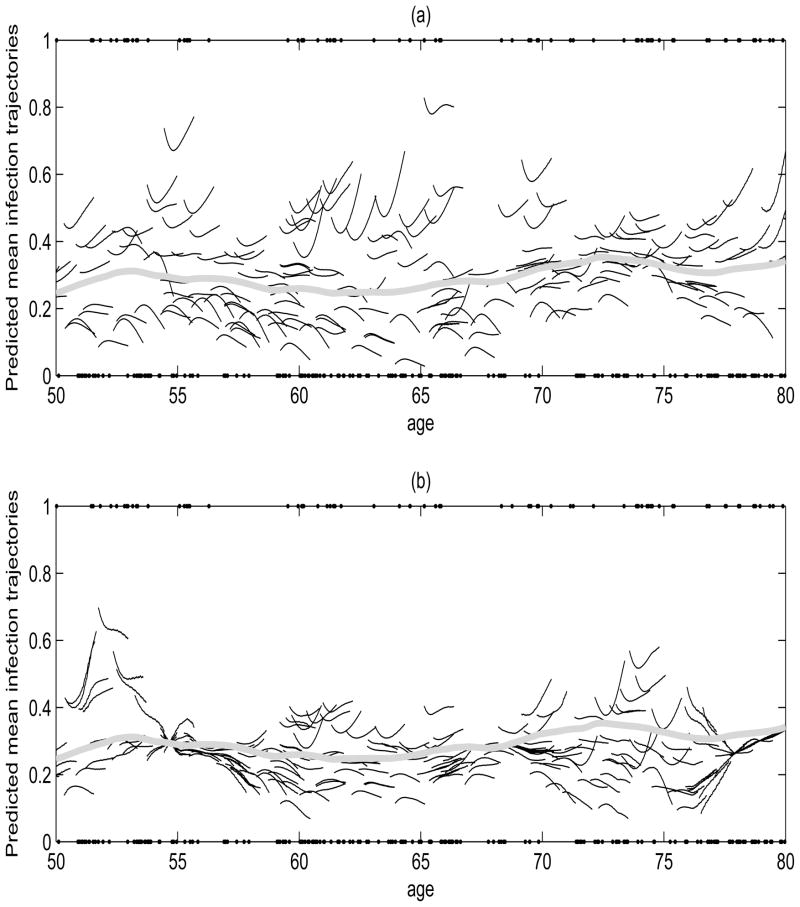
Figure 3.
(a)–(b) Observed values (dots) for presence of an infection-related hospitalization and predicted subject-specific mean response curves (solid) based on moments estimates (a) and reconstruction estimates (b). Also displayed (thick solid gray) is the smoothed estimate of the mean function μ̂Y (age) of infection.

