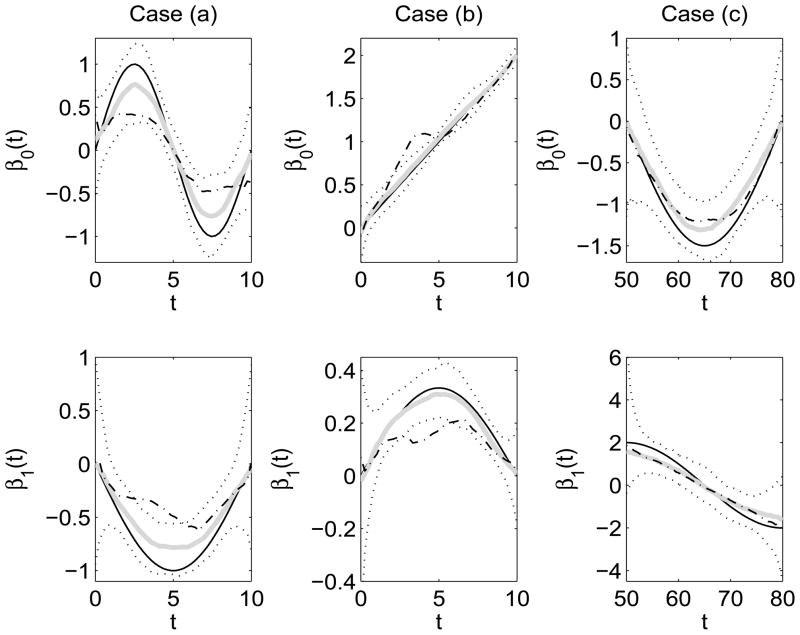
Figure 5.
Simulation results on estimated varying coefficient functions β0(t) and β1(t) for the three simulation set-ups: case (a) unsynchronized binary response, case (b) unsynchronized count response and case (c) unsynchronized binary response with diagonal support analogous to the CDS data. Displayed results are from simulations with σ2 = 4. The cross-sectional median curves of the proposed moments estimates (thick solid grey) along with 5% and 95% cross-sectional percentiles (dotted) are plotted along with the true varying coefficient functions (solid). Also displayed are the cross-sectional median curves from binning fits (dash-dotted). Percentiles presented are based on 200 Monte Carlo runs/data sets.

