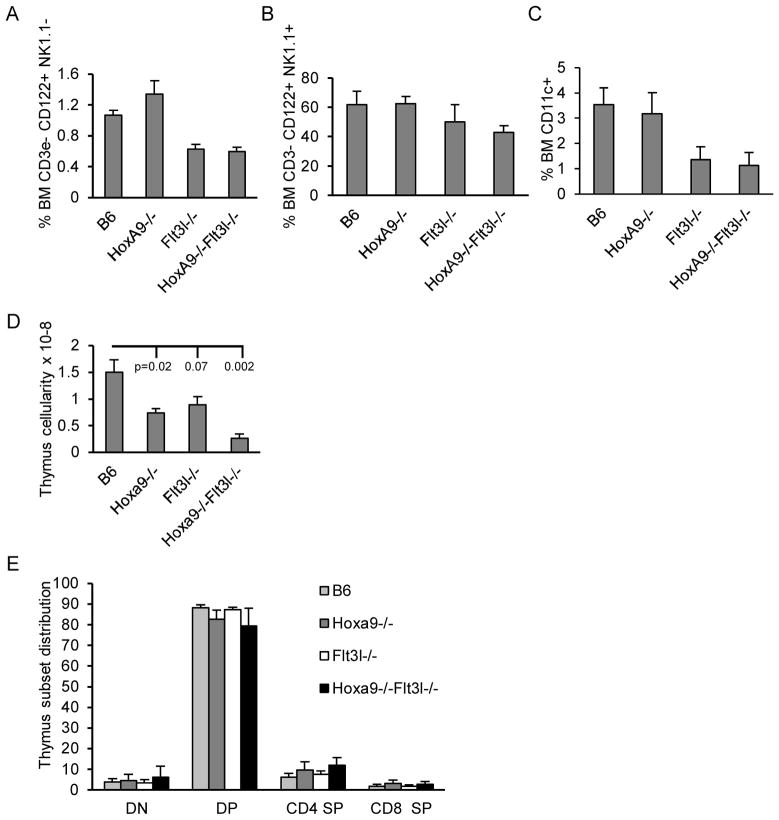
Figure 3. Alternate lymphoid lineage analysis of Hoxa9−/− Flt3l−/− mice.
BM cells were harvested as we previously described and incubated with combinations of antibodies to resolve NK or DC differentiation by flow cytometry. The data in A) represents precursor frequency of NK progenitors defined as CD3ε− CD122+ NK1.1−. The data in B) represents precursor frequency of mature NK cells defined as CD3ε− CD122+ NK1.1+. C) Percentages of total CD11c+ DC lineage cells in BM. The data is representative of mean frequencies ± standard deviation of 3–4 BM analyses per genotype. D) Thymi were harvested from mice of each genotype and nucleated cell counts determined. The data is representative of mean frequencies ± standard deviation of 4 animals per genotype. Statistical significance is compared to B6 controls. E) Thymic cell suspensions incubated with anti-CD4-FITC and anti-CD8-PE and flow cytometric analysis performed. Precursor frequencies of the four major T cell developmental subsets were evaluated based on differential expression of CD4 and CD8. DN=CD4− CD8−, DP=CD4+ CD8+, CD4 SP indicates CD4 single positive, and CD8 SP indicates CD8 single positive. The data is representative of mean frequencies ± standard deviation of 4 thymic analyses per genotype.

