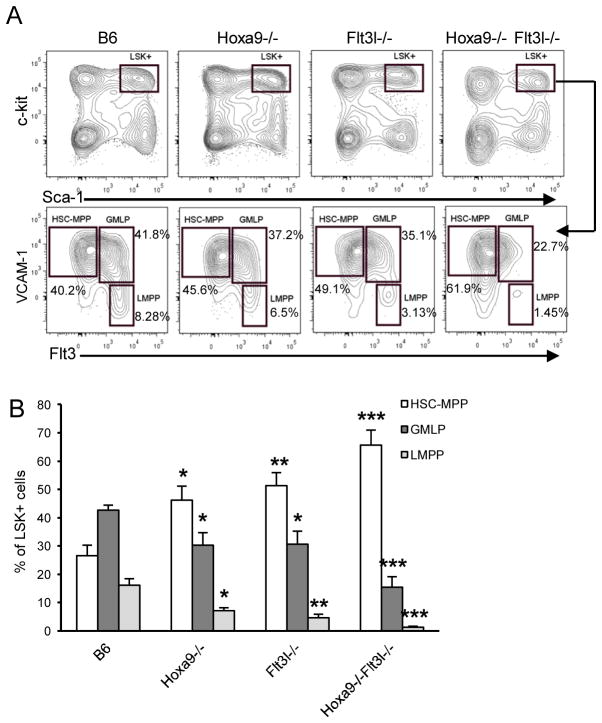
Figure 5. Reductions in GMLP and LMPP in Hoxa9−/−Flt3l−/− mice.
A) LSK+ cells were discriminated as Lin− (not shown) c-kithi Sca-1+ (boxed region). HSC/MPP, GMLP, and LMPP was resolved within the LSK+ gate based on differential expression of VCAM-1 and Flt3. B) Summary of HSC/MPP, GMLP, and LMPP subset frequencies as a percentage of LSK+ cells. Data represents the mean and standard deviation of 4–5 mice per genotype.

