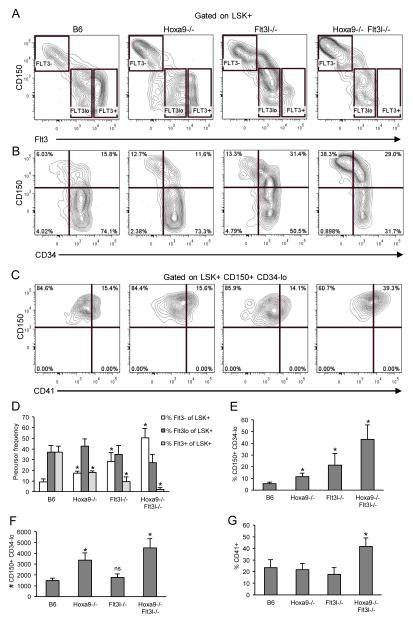
Figure 6. Alterations in HSC/MPP subsets in Hoxa9−/−Flt3l−/− mice.
A) Synergistic reduction in LSK+ CD150− Flt3+ cells in Hoxa9−/−Flt3l−/− mice. LSK+ cells were visualized based on differential expression of CD150 and Flt3 then fractionated by Flt3 density into Flt3−, Flt3lo, and Flt3+ subsets (boxed regions, left to right, respectively). The boundaries of the boxed regions were determined based on loss of CD150 expression which accompanies acquisition of Flt3. B) Increase in LSK+ CD150+ CD34−lo progenitors in Hoxa9−/−Flt3l−/− mice. C) Increased percentage of CD41+ LSK+ CD150+ CD34−lo myeloid-biased cells in Hoxa9−/−Flt3l−/− mice. D) Summary of Flt3−, Flt3lo, and Flt3+ LSK+ subsets in the four genotypes. E) Summary of LSK+ CD150+ CD34−lo progenitors in the four genotypes. F) Absolute number of LSK+ CD150+ CD34−lo cells per 4 hind limb leg bones per genotype. G) Summary of percentages of CD41+ cells within the LSK+ CD150+ CD34−lo gate. Bar graphs reflect the mean ± SD of 3–5 mice per genotype.

