
Figure 5.
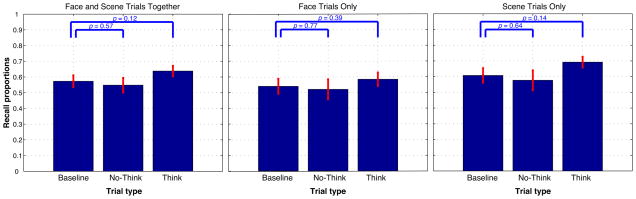
Memory performance on the final test (operationalized as the percentage of items where both category and item responses were correct), as a function of condition. Left panel: data for face trials and scene trials combined; middle panel: data for face trials only; right panel: data for scene trials only. Error bars indicate the SEM. Within each panel, think and no-think memory performance were compared to baseline using an across-subjects paired t-test.