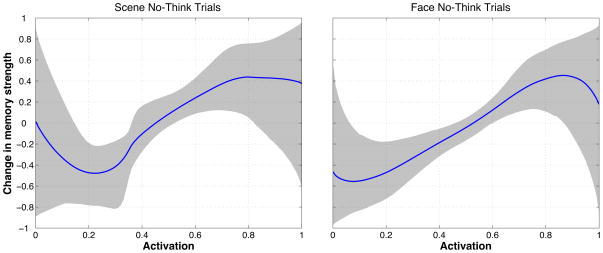
Figure 9.
Results from our curve-fitting procedure, applied to data from no-think trials with scene associates (on the left) and face associates (on the right). In both figures, the dark line indicates the mean of the posterior distribution over curves, and the gray ribbon indicates the 90% credible interval (i.e., 90% of the probability mass is contained within the gray ribbon).

