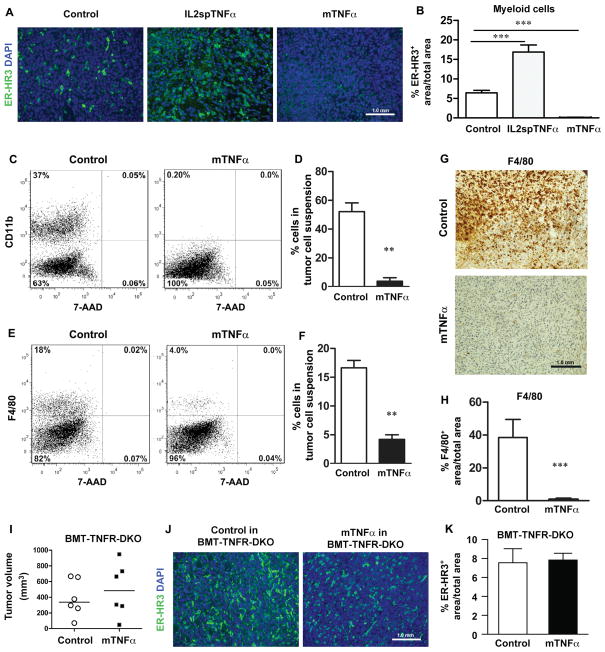
Figure 3. mTNFα-expressing tumors are devoid of tumor-associated myeloid cells.
(A) ER-HR3 staining of LLC tumor cells, expressing various TNFα isoforms. Control (left), IL2spTNFα (middle), and mTNFα (right) LLC tumor sections from wild-type bl/6 were stained with ER-HR3 myeloid markers (green). (B) Percentage of ER-HR3-positive cells in LLC tumors transduced with control or different of TNFα isoforms was quantitated. There was a significant decrease in the number of ER-HR3-positive cells in LLC tumors expressing mTNFα isoform compared to control tumors. (C and E) Representative flow cytometric analysis of CD11b- and F4/80-postitive population in LLC tumor cell suspension. Dot plots show CD11b/7-AAD (C) and F4/80/7-AAD (E) from one representative animal for each group. (D and F) Percentage of CD11b- and F4/80-positive cells were quantitated in control and mTNFα tumor cell suspensions. (G) Representative sections of control and mTNFα-transfected LLC tumors were analyzed by immunohistochemistry for F4/80+ macrophages. (H) Number of F4/80-postivie cells in control and mTNFα in LLC tumors was quantitated. (I) Control and mTNFα-expressing LLC tumor cells were implanted subcutaneously in WT bl/6 mice received bone marrow (BM) transplant from TNFα receptors1/2 knockout donor (BMT-TNFR-DKO mice) for 14 days. The mean is shown for each group (n=6 animals). (J) Representative ER-HR3 immunofluorescence staining from control and mTNFα-transduced tumors. (K) Percentage of ER-HR3-positive cells in control and mTNFα-expressing LLC tumors from WT mice with BMT from DRKO donor was quantitated. There was no significant difference between the cohorts for ER-HR3-positive cells (n=3). Data are presented as mean±SEM, **P<0.005, ***P<0.0005; Student’s t-test.

