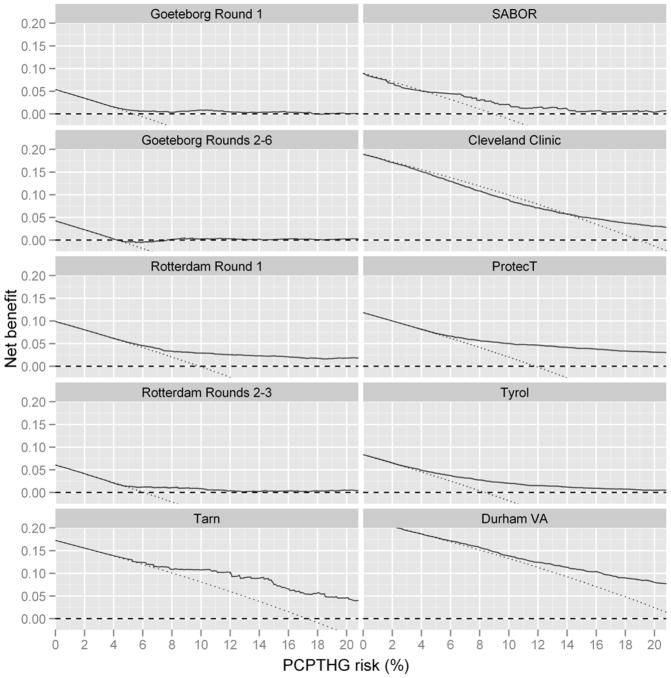
Figure 2.
Net benefit curves for the PCPTHG (solid black line) versus the rules of biopsying all men (dashed line) and no men (dotted horizontal line at 0). A risk tool has clinical benefit when a specific risk threshold (x-axis) is used for referral to biopsy when its net benefit curve is higher than the curves corresponding to biopsying all men or no men.

