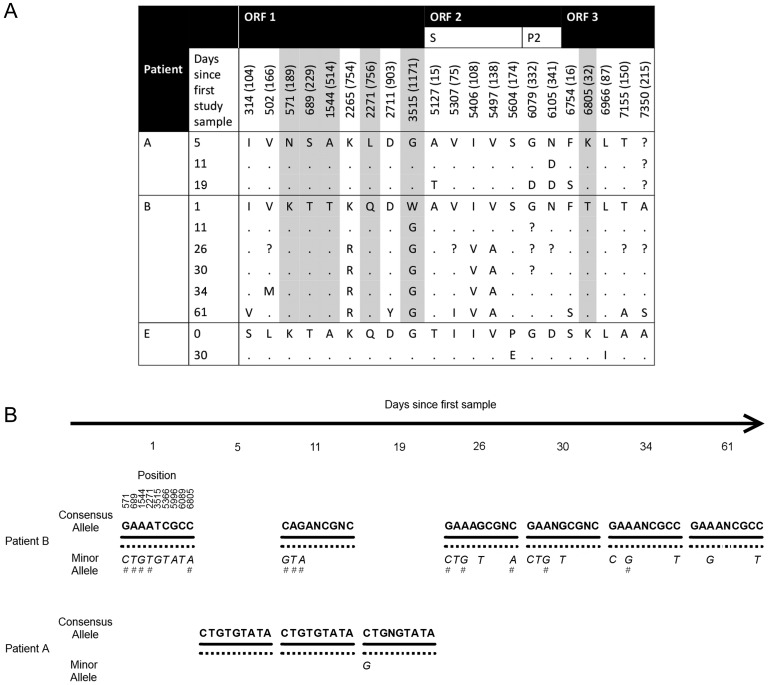
Figure 2.
A, Amino acid variation in longitudinally sampled patients A, B, and E (amino acid position is shown in brackets). Dots indicate no difference with the site in the first sample (from each patient), and “?” indicates missing data. Amino acid sites highlighted in gray were informative for norovirus transmission between patient A and B. B, Norovirus allele profiles in patients A and B indicate that the minor alleles in B are present in patient A in the majority. The hash marks indicate those positions where the minor allelic frequency is ≥5%. Abbreviation: ORF, open reading frame.

