
Figure 1.
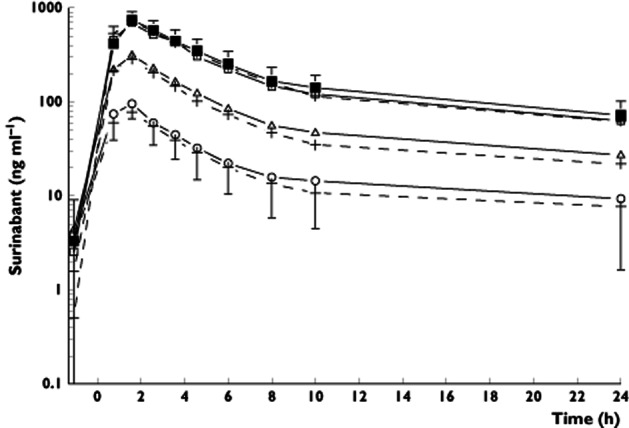
Mean and predicted plasma concentration–time curve of surinabant with SDs. Surinabant was administered at time point zero and the first blood sample for bio-analysis was taken pre-dose. The open circles are surinabant concentrations after surinabant 5 mg + THC, the open triangles are surinabant 20 mg + THC, the open squares are surinabant 60 mg + THC treatment and the closed squares are after surinabant 60 mg + placebo THC treatment. The dotted lines with plus signs represent the predicted surinabant plasma concentration−time curves