
Figure 3.
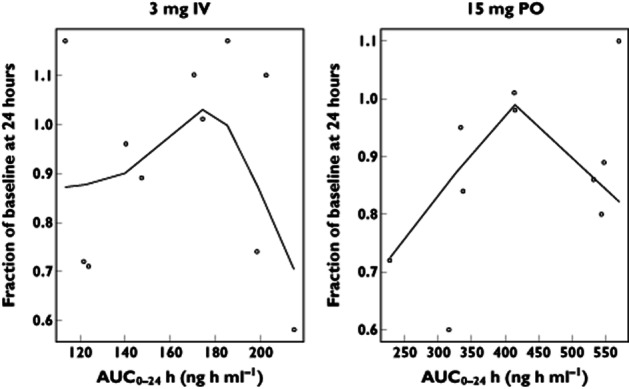
AUC0–24 vs. change from baseline high-sensitivity C-reactive protein (hsCRP) with smooth (i.e. a lowess fit curve). No exposure–response relationship was demonstrated. The hsCRP values were below the limit of quantification for one subject following 3 mg IV dosing and two subjects following 15 mg PO dosing