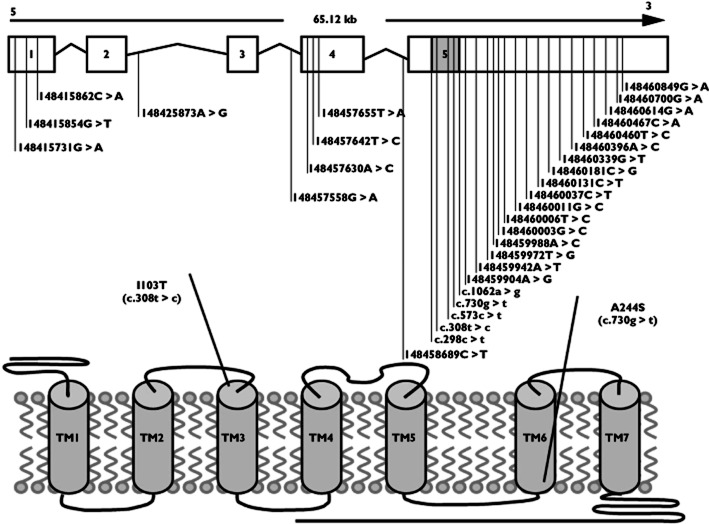
Figure 1.
Topological model of the AT1 gene and the AT1 protein. Upper panel shows the relative position of genetic variations identified during resequencing of exons 1–5. Open boxes indicate untranslated exons. Shaded box indicates the coding region of exon 5. Lines indicate introns. Lower panel shows the relative position of the two nonsynonymous variants selected for genotyping in the Copenhagen City Heart Study and the Copenhagen General Population Study

