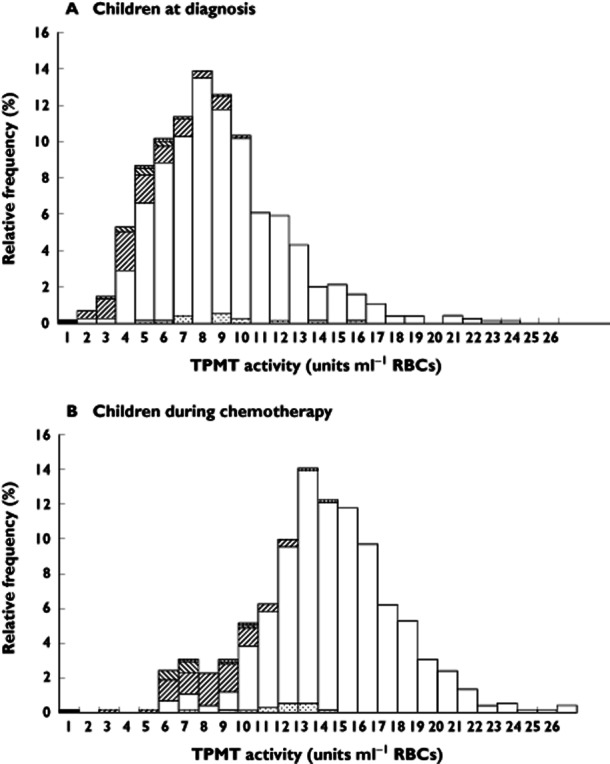
Figure 3.

TPMT frequency distribution histograms for 755 children at disease diagnosis (median 8.5 units, range 0–38) and for those same children during thiopurine maintenance chemotherapy (median 13.8 units, range 0–26). The histograms are plotted to 26 units, histogram (A) omits one child who had an at diagnosis TPMT activity of 38 units. Thiopurine genotypes were available for 741 of the 755 children. ▪, TPMT*3A/*3A;  , TPMT*1/*2;
 , TPMT*1/*3C;
  , TPMT*1/*3A; □, TPMT*1/*1;
 , no genotype
