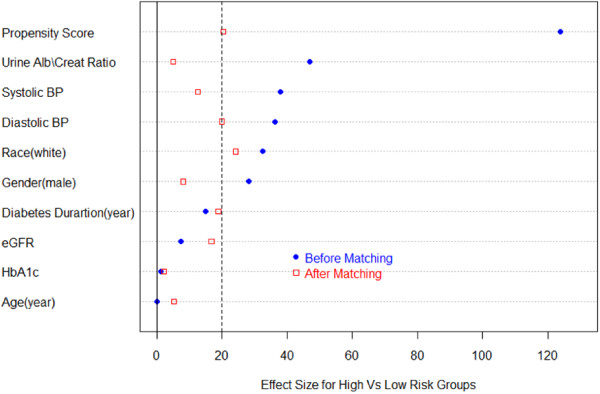
Figure 3.

Plot of effect sizes (difference in means divided by the standard error) comparing propensity to be a high risk subject and covariate differences between risk groups before and after propensity matching. An effect size ≤ 0.20 (at the dashed line) represents a relatively small difference between risk groups on the propensity score or covariate.
