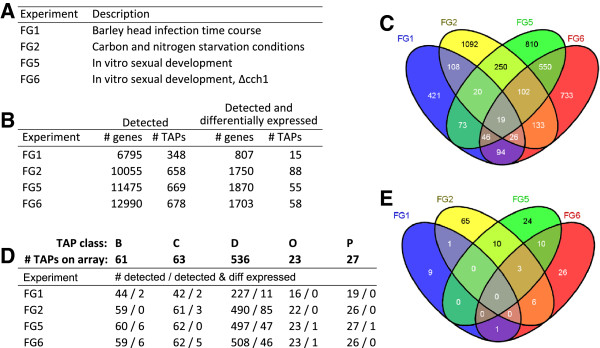
Figure 3.

Genes expressed in transcriptomics experiments. (A) Gene expression data sets used in the study, listed by PlexDB identifier and description. (B) Number of genes expressed (Detected – ‘# genes’) and the number which are TAPs (‘# TAPs’ ) within each F. graminearum transcriptomics data set, and number that are also differentially expressed (‘Detected and differentially expressed’). (C) Venn diagram [21] summarizing the distribution of differentially expressed genes across the four sets of conditions. (D) Number of TAPs in each TAP class which were detected, or detected and differentially expressed, within each experiment (B, C, D, O, P; Table 1). (E) Venn diagram showing the overlap of DNA-binding TAPs differentially expressed in the microarray experiments.
