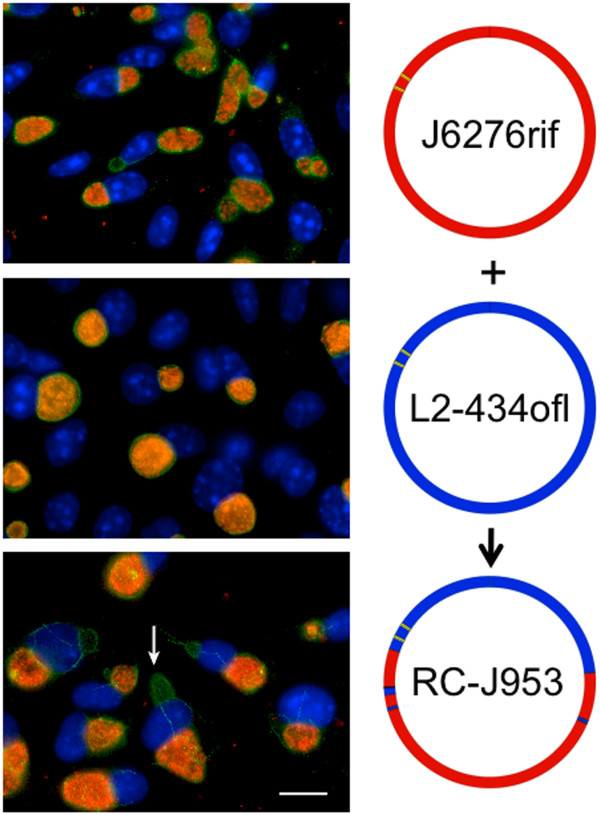
Figure 7.

Fluorescent microscopic analysis of the secondary inclusion formation phenotype of recombinant strain RC-J/953. McCoy cells were infected at an MOI of ~0.5, and images were taken 48 h post-infection. All cells were labeled with anti-IncA (green), and anti-OmpA (red), and DNA is labeled with DAPI (blue). A representative secondary inclusion is indicated by the white arrow in the bottom panel. The strain being analyzed is shown at the right of each image. Scale bar, 10 μm.
