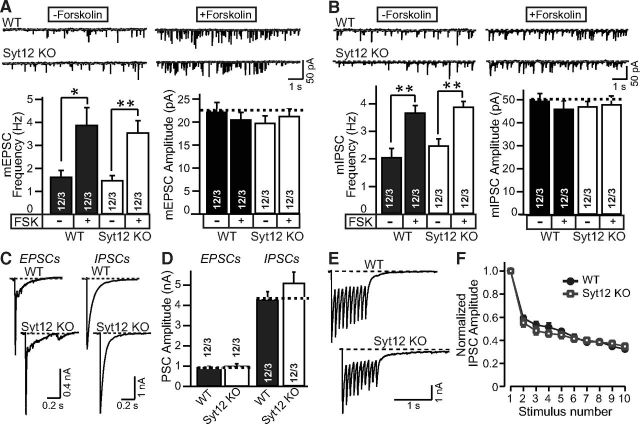
Figure 3.
Syt12 is not required for spontaneous or evoked neurotransmitter release in cortical neurons cultured from littermate WT and Syt12 KO mice. A, B, Representative traces (top) and summary graphs of the frequency and amplitudes (bottom) of mEPSCs (A) and or mIPSCs (B) with or without forskolin treatment (50 μm for 1 h), respectively. C, D, Representative traces (C) and summary graphs of the amplitudes (D) of EPSCs and IPSCs that were evoked by a single test pulse. E, Representative traces of IPSCs evoked by a 10 Hz stimulus train applied for 1 s. F, Plot of IPSC amplitudes during the 10 Hz stimulus train normalized to the first peak amplitude and plotted against the stimulus number. Data are means ±SEM; numbers of cells/independent cultures analyzed are shown in the bars. Statistical assessments were performed by Student's t test (*p < 0.05; **p < 0.01).

