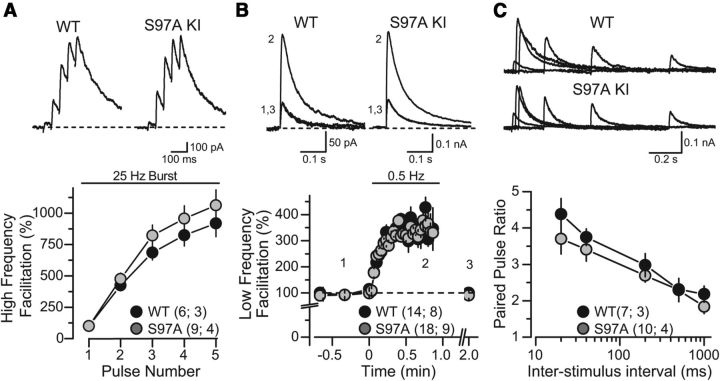
Figure 6.
Characterization of excitatory synaptic transmission at mossy fiber synapses in acute slices of the hippocampal CA3 region from WT and Syt12 S97A KI mice (all data represent whole-cell recordings of NMDA receptor-mediated EPSCs). A, High-frequency facilitation triggered with a presynaptic 25 Hz stimulus burst. Representative traces are shown on top, and summary graphs of the EPSC amplitudes on the bottom (normalized to first pulse in the burst after subtracting the baseline current that was reached before each new pulse). B, Low-frequency facilitation induced by changing the baseline stimulation frequency from 0.05 Hz to 0.5 Hz. Traces (above) were taken from a representative experiment whose time points match the numbers indicated in the summary graph (below). C, Measurements of the PPR. Representative traces of two sequential EPSCs evoked with increasing interstimulus intervals (top) and summary graphs of the resulting paired-pulse ratio (bottom) were obtained from slices from littermate WT and S97A KI mice. Inter-stimulus intervals of 20, 40, 200, 500, and 1000 ms were tested. Data are means ±SEM. Number of slices/mice tested are indicated in parenthesis. No significant difference in any of the comparisons was found using Student's t test (p > 0.05).

