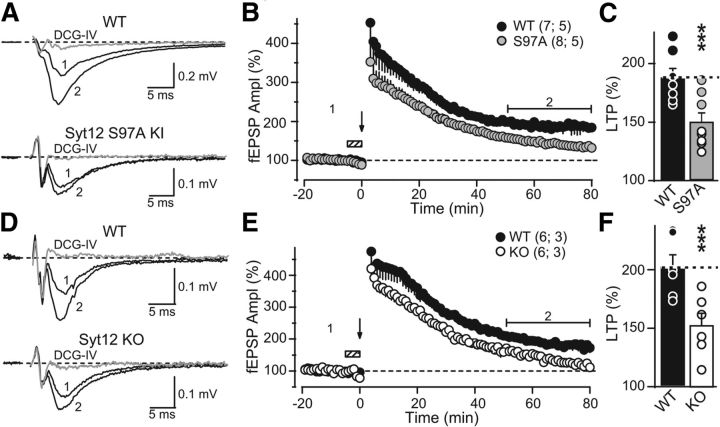
Figure 7.
The Syt12 S97A KI and the Syt12 KO impair mfLTP as monitored by extracellular field recordings. A, Representative traces of mossy fiber field-EPSPs (fEPSPs) before (trace 1) and after (trace 2) induction of mfLTP in acute slices from littermate WT and Syt12 S97A KI mice. mfLTP was induced by two 25 Hz/5 s stimulus trains separated by 20 s and applied in the presence of the NMDA-receptor antagonist d-APV (50 μm) that was washed out immediately after induction. After each individual mfLTP experiment, the slice was exposed to 1 μm DCG-IV, a group II mGluR agonist, to determine the relative contribution of mossy fiber synaptic inputs to the fEPSP (gray traces). B, Summary data of mossy fiber fEPSP amplitudes plotted as a function of time before and after mfLTP induction (arrow). Hatched box indicates the period when the slice was exposed to d-APV. For clarity, the DCG-IV block data were removed from the summary graph. Numbers indicate time-points for the traces shown in A. C, Distributions for the magnitude of LTP observed in each genotype, with circles indicating the values observed in individual experiments (WT, 187.6 ± 8.4% of baseline; S97A KI, 143.2 ± 8.5% of baseline; p < 0.003 by Student's t test). D–F, Same as A–C, except that mfLTP was examined in Syt12 WT and KO littermate mice. Circles in F indicate the values observed in individual experiments (WT 202.0 ± 10.7% of baseline; KO 145.6 ± 11.3% of baseline; p < 0.005 by Student's t test). Data shown are means ±SEM. Number of slices/mice tested are indicated in parenthesis. Horizontal brackets in B and E indicate the time window where the magnitude of LTP was measured. Given the large magnitude of PTP observed in extracellular recordings, the first three points after the stimulus trains were digitally removed to facilitate visualization of LTP. These points were not different between groups.

