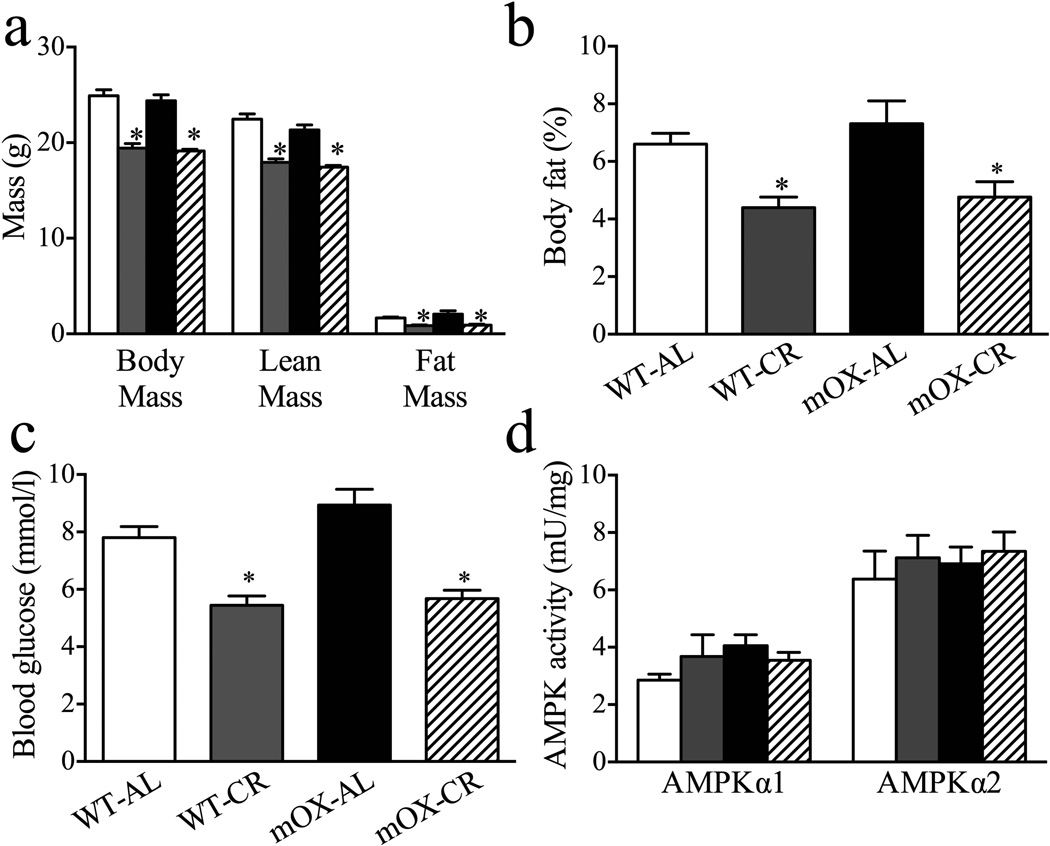
Fig. 3.
Metabolic profiles and skeletal muscle AMPK activity in WT and mOX mice. Beginning at 10 weeks of age, WT and mOX mice were fed a StD or EnR diet for 20 days. White bars, WT-StD; grey bars, WT-EnR; black bars, mOX-StD; hatched bars, mOX-EnR. (a) Body mass was measured to 0.1 g, and lean and fat mass were determined by MRI (n=10–19). (b) Per cent body fat was calculated from fat and body mass measurements (n=9–19). (c) Basal glucose levels (n=10–19) in fasted mice. (d) AMPK α1 and α2 complexes were immunoprecipitated and their activities quantified (n=6) in GA muscle. Values are mean±SEM; *p<0.05 for effect of diet

