
Figure 8.
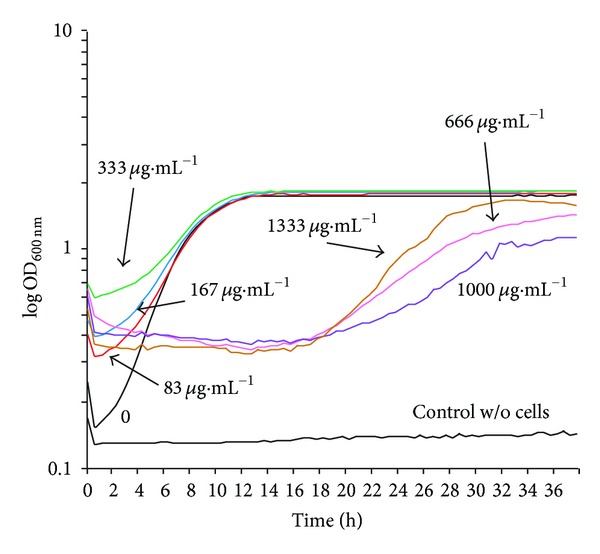
Growth curves of C. albicans strain ATCC 10231 with different concentrations of chitosan. The cells (0.03 final optical density units at 600 nm) were placed into 300 μL of YPD in the presence of indicated chitosan concentrations and growth was followed for 40 h.