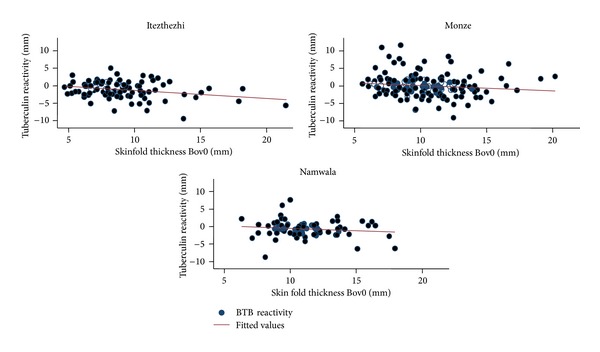
Figure 2.

Scatterplot and regression line showing the relationship between BTB reactivity ((Bov72 − Bov0) − (Av72 − Av0)) and intial skinfold thickness at bovine site (Bov0) by District (Itezhitezhi, n = 102; Monze, n = 176; Namwala, n = 181) where reduced BTB reactivity was observed with increasing skinfold thickness. Skin fold thickness at the bovine site was negatively correlateded with tuberculin reactivity.
