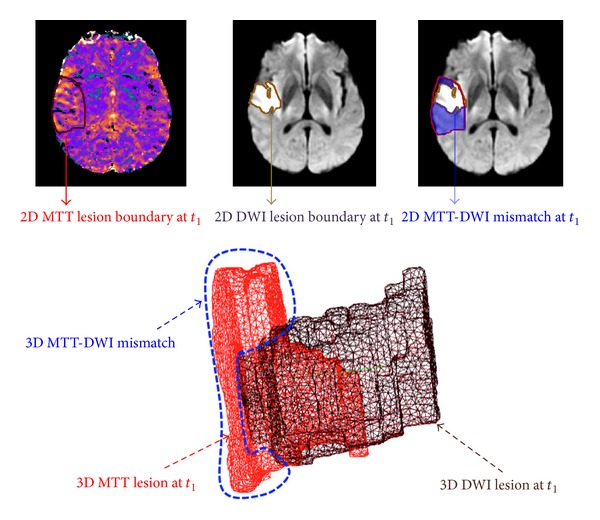
Figure 1.

MTT-DWI mismatch at first acquisition acute timepoint t 1. Top row: MTT-DWI mismatch area in blue visualised on 2D MR axial slices. Bottom row: the 3D reconstruction of MTT and DWI surfaces and their corresponding mismatch spatially defined as the “output space” produced when taking the diffusion volume out of the perfusion one, outlined in blue.
