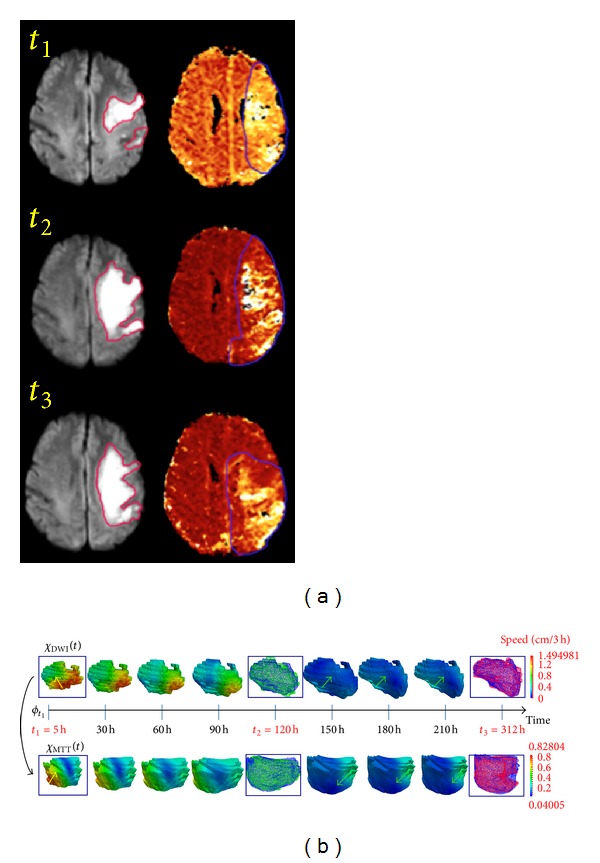
Figure 3.

Estimated DWI/MTT lesion evolution scenarios. (a) DWI (versus MTT) axial slice at 3 timepoints in the first (versus second) column. (b) Estimated DWI/MTT evolution scenarios with estimated velocity norm (speed) in cm/3h. In the Supplementary Material of this paper, we have included a video (Video 1) which visualizes the 4D evolution of both MTT (in red) and DWI (in blue) lesions—as if in “real” time. At t 2 (versus t 3), the green (versus red) surface represents the observed lesion, and the blue one represents the estimated lesion. Green arrows represent contraction areas and yellow ones expansion areas.
