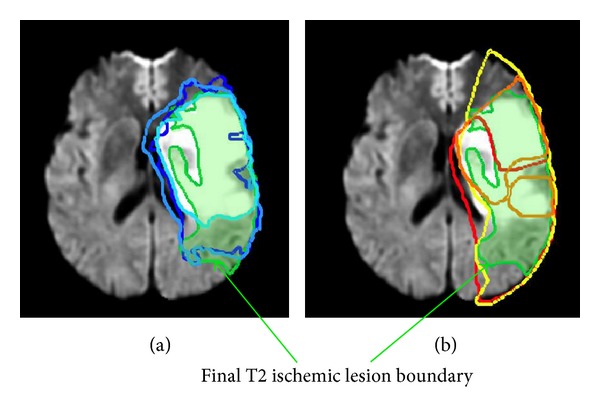
Figure 4.

Time-indexed penumbra and core lesion boundaries combined to final T2-weighted boundary imaged at >1 month. (b) MTT manually delineated penumbra boundaries consecutively at t 1 (in orange), t 2 (in yellow), and t 3 (in red). (a) DWI lesion boundaries ranging from light to dark blue as time evolves from t 1 to t 2 and then t 3. In both MR axial slices, the final T2 boundary is displayed in green shading.
