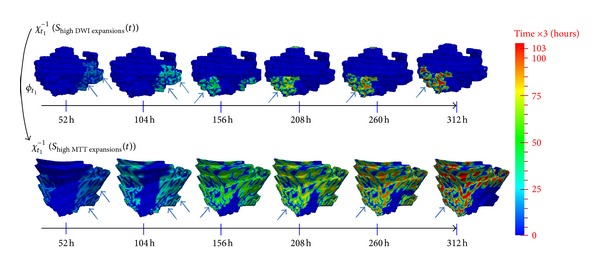
Figure 5.

Comparison between highly expanding DWI and MTT areas extracted across the spatiotemporal estimated scenarios. As the color ranges from blue to green to red, the different successive areas with high expansion speed are “lit up” at each time step, all mapped back at the baseline lesion shape acquired at t 1 using the inverse of the estimated evolution function χ t1 −1(S highDWIexpansions(t)) for DWI lesion and χ t1 −1(S highMTTexpansions(t)) for MTT lesion. The mapping back enables us to foresee the upcoming dynamic changes—more precisely expansions—on the acute baseline lesion surface. In the Supplementary Material of this manuscript, we included Video 2 (resp., Video 3) where you can see the “lighting up” process of successively highly expanding DWI (resp., MTT) regions along the evolution process; all are visualized on the baseline surface at the first acquisition timepoint t 1. The blue arrows point to highly expanding areas in DWI lesion and their corresponding areas that also expanded in the MTT lesion. The dark blue areas—that did not change color as time evolved—did not expand; that is, they contacted.
