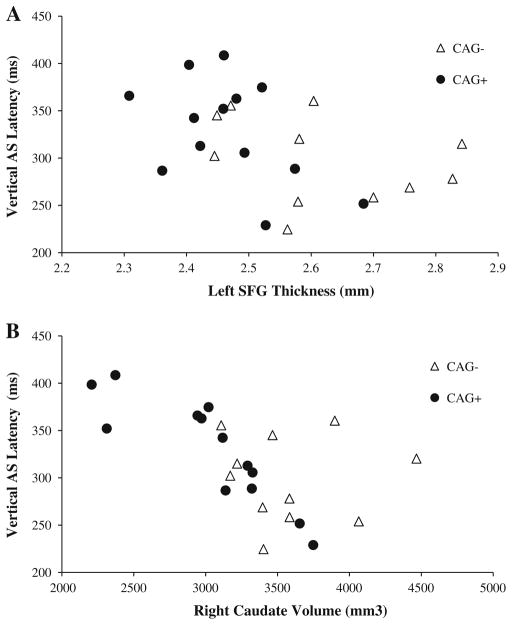
Fig. 1.
Plots of vertical AS latency and structural measures. Filled circles represent CAG+ individuals, and unfilled triangles represent CAG−. Plots show unadjusted values of vertical AS latency versus left SFG thickness (Spearman correlation coefficient −0.62, p = 0.05) (a) and right caudate volume (Spearman correlation coefficient −0.91, p = 0.0003) (b). Note: Only CAG+ individuals were included in the statistical analysis; CAG− individuals are shown for reference

