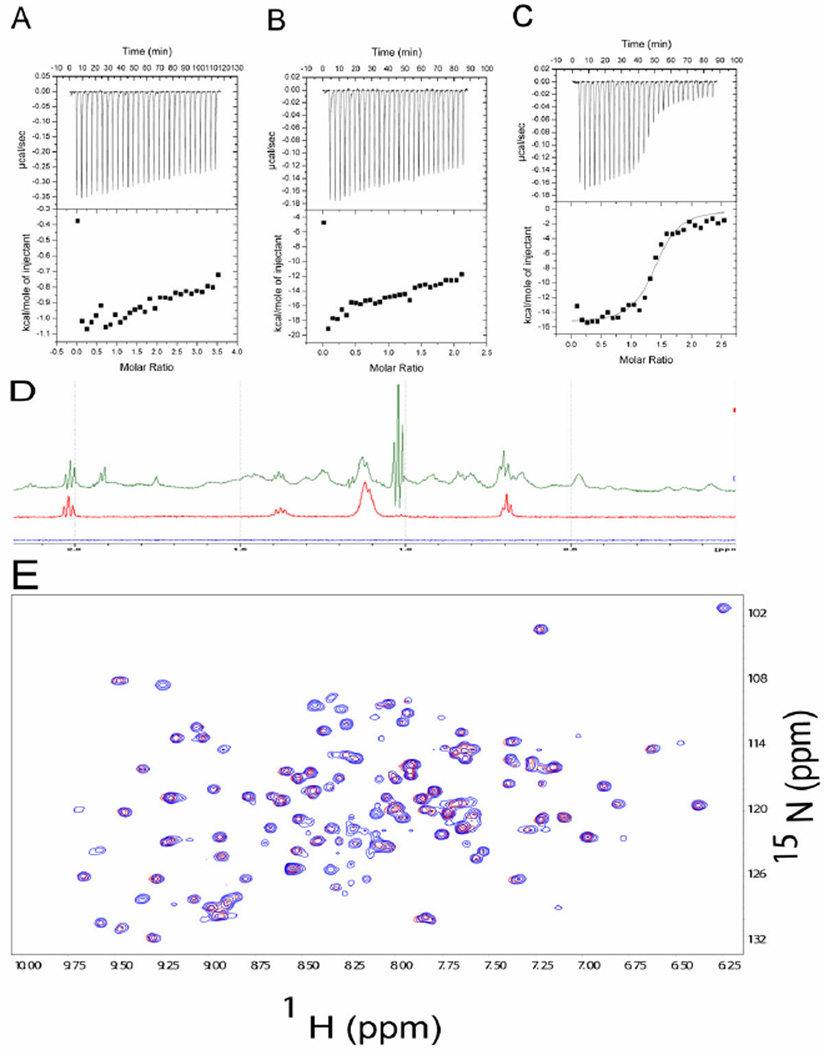
Figure 7.
Probing TgADF - dioctonoyl PI(4,5)P2 interaction by ITC and NMR. The negative peaks indicate an exothermic reaction. The area under each peak represents the heat released after an injection of TgADF into ADP-G-Actin solution. (Lower) Binding isotherms obtained by plotting peak areas against the molar ratio of TgADF to ADP-G-Actin. The lines represent the best-fit curves obtained from least-squares regression analyses assuming a one-site binding model. (A) ITC of TgADF-dioctonoyl PI(4,5)P2. (B) ITC of Rabbit muscle ADP-G-actin-dioctonoyl PI(4,5)P2. (C) TgADF-dioctonoyl PI(4,5)P2+ Rabbit muscle ADP-G-actin. (D) 1-D spectra of buffer (blue), dioctonoyl PI(4,5)P2 (red), dioctonoyl PI(4,5)P2 in presence of TgADF (green). (E) 1H-15N HSQC spectra overlap of TgADF (red) and TgADF in presence of dioctonoyl PI(4,5)P2 (blue).

